X
*This article was written by guest author Tanner Scott. He is the founder and CEO of Ranksey Digital Marketing, a growth marketing agency that helps eCommerce brands scale with improved acquisition and retention marketing strategies.
In eCommerce, there is an astounding number of eCommerce KPIs that you could be tracking for your online store. Aside from tracking high-level KPIs like revenue and transactions, there are some very important KPIs that can help you determine what you need to do to increase the performance of your online storefront. It isn’t always clear which KPIs you should be tracking, so we’ve put together a list of the top 10 eCommerce metrics you should be tracking for your store.
We made a table that gives a clear overview of all of them at the bottom of this article that you can download and print.
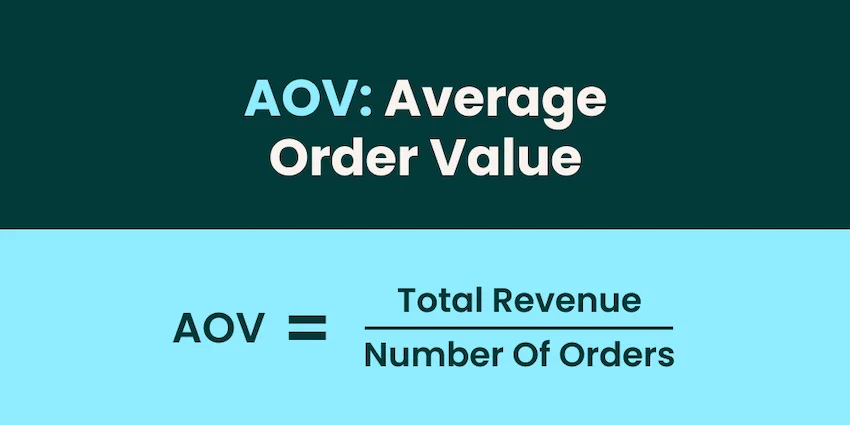
Average Order Value is a metric used to track how much your customers spend at checkout on average. This metric is important to track because seeing what your AOV is allows you to set clear goals for your store.
If your AOV is $100, your goal is to make $10,000 in revenue, then you need 100 customers to buy something.
With these numbers in mind, you can see where you should shift your focus regarding increasing AOV and acquiring new customers and how it will impact your revenue.
Here’s how to find your store’s AOV:
AOV = Total Revenue / Total Number of Orders
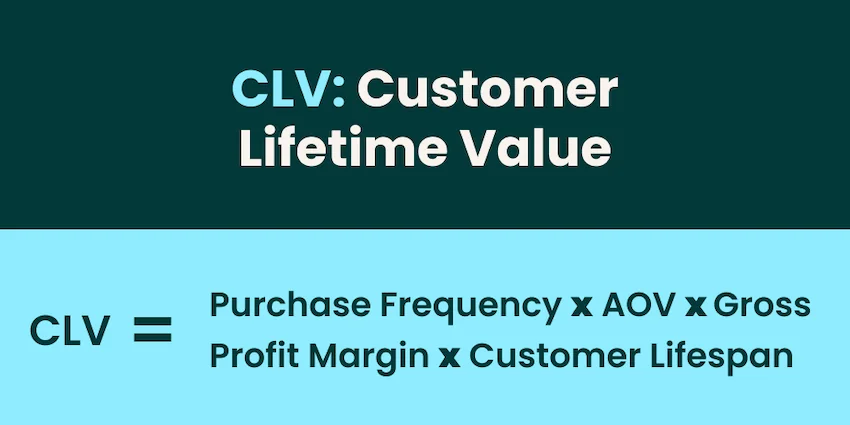
Customer Lifetime Value measures how valuable your customers are over their lifetime with your brand.
Here’s how to calculate CLV:
CLV = Purchase Frequency x AOV x Gross Profit Margin x Customer Lifespan
By multiplying AOV and Purchase Frequency, you’ll be able to see how much revenue a customer generates in a year, assuming you calculate purchase frequency based on a yearly timeframe. When you multiply this number by your Gross Profit Margin, you are now accounting for your Cost of Goods Sold, so it’s based on profit instead of revenue. After having your yearly profit per customer, you multiply that by the average lifespan to show you how much they are worth.
Calculating CLV is important because it puts into perspective how much your customers are worth. For instance, if it costs you $100 to acquire a new customer, but that customer only generates $300 in their relationship with you, then you are spending too much to acquire new customers relative to your CLV. A good rule of thumb is for your CLV to be 10x your acquisition cost.
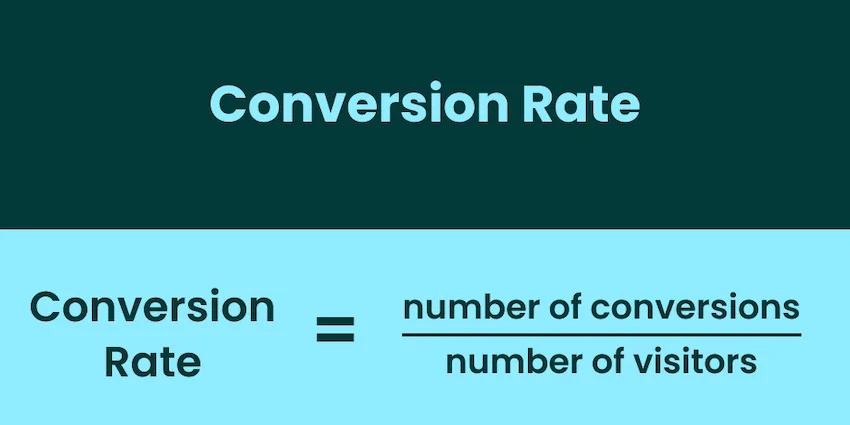
Your website’s conversion rate is something you want to keep a close eye on. Optimizing for a higher conversion rate is ultimately how you increase revenue.
It’s best practice to track your conversion rate by different channels as well. Looking at your overall conversion rate is helpful, but seeing how your conversion rate compares from organic visitors to paid visitors gives you much better insight.
For instance, if you find that your conversion rate is low across the board, then it may be time to optimize, or even redesign your website. However, if your organic conversion rate is high but your conversion rate on your ads is low, this could be due to poorly optimized ads.
This is the formula for conversion rates:
Conversion rate = number of conversions / number of visitors
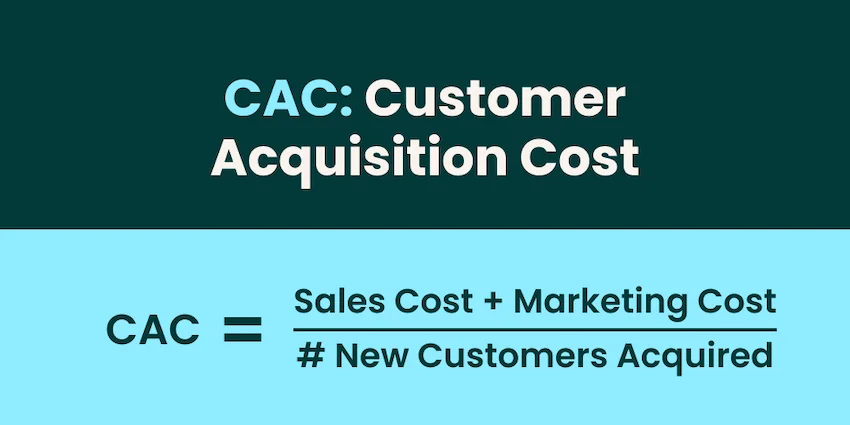
Customer Acquisition Cost is a metric that calculates the average of how much it costs you to acquire more customers.
The majority of these costs are going to be associated with advertising, but there can be additional costs outside of your ad spend. For example, if you don’t advertise, but you have salespeople pushing your products or services, their wages and/or commissions can be factored into acquisition costs.
Here’s how to calculate CAC:
CAC = Sales and Marketing Costs / Number of New Customers
If you spent $1,000 on an ad campaign that resulted in 25 new customers, then your CAC would be $40.
Might also interest you:
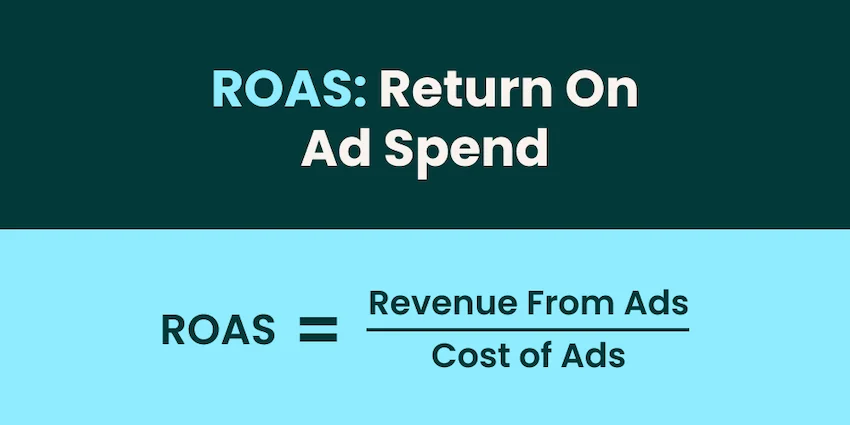
ROAS is a metric used to track how much revenue your ads generate. When you spend money on advertising, it’s important to be able to measure the success of your ad spend so you don’t waste your capital.
Here’s how to calculate ROAS:
ROAS = Revenue Generated / Ad Spend
The ROAS your brand should target will vary based on a few factors, but the biggest thing to consider is your Gross Profit Margin. With your Gross Margin, you can calculate what your Break-Even ROAS is, and define what you should be targeting based on that.
Here’s the formula for finding your Break-Even ROAS:
Break-Even ROAS = 100% / Gross Margin
If your Gross Margin is 25%, then you would divide 100% by 25% and get a Break-Even ROAS of 4, which would translate to a 400% ROAS. This means your ads need to make 4x what you spend just to break even.
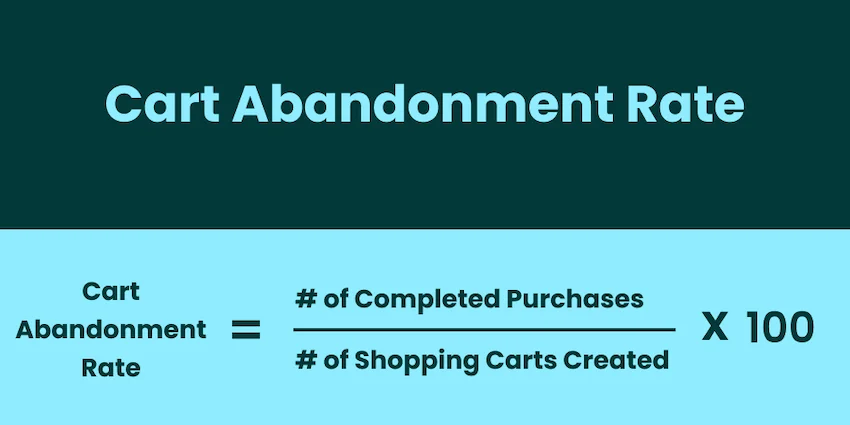
Cart Abandonment Rate is an indicator for how efficient and effective your checkout process is. If a lot of people are adding items to cart, but don’t complete the purchase, this could tell you that there are problems with the checkout process. This isn’t something you need to closely track, but it’s good to keep an eye on it.
Here’s how you can calculate it:
Shopping Cart Abandonment Rate = (# of Completed Purchases / # of Shopping Carts Created) x 100
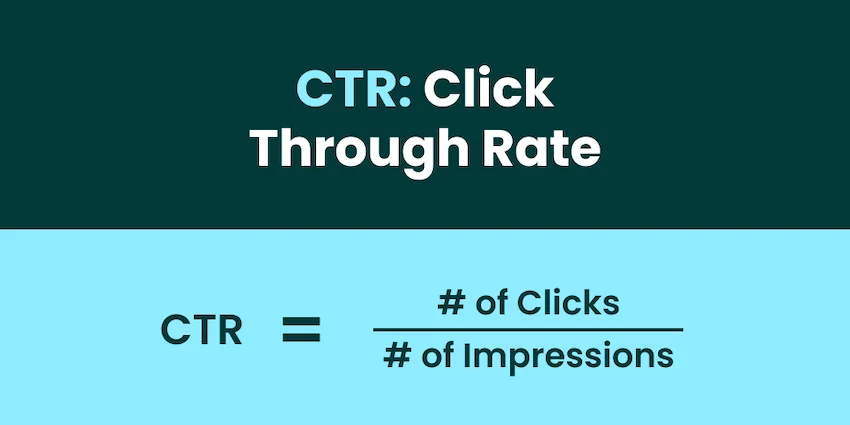
Click Through Rate is the rate at which users click on your marketing campaigns. This rate is used to measure both paid and unpaid marketing efforts, including PPC advertising such as Google Ads or Facebook Ads, email campaigns, or your social media posts.
Here’s the formula for calculating CTR:
CTR = # of Clicks / # of Impressions
Repeat business is a goal that every brand should strive for because of the extra value it brings. Retaining customers is much cheaper than acquiring new ones, so this makes increasing repeat purchases desirable.
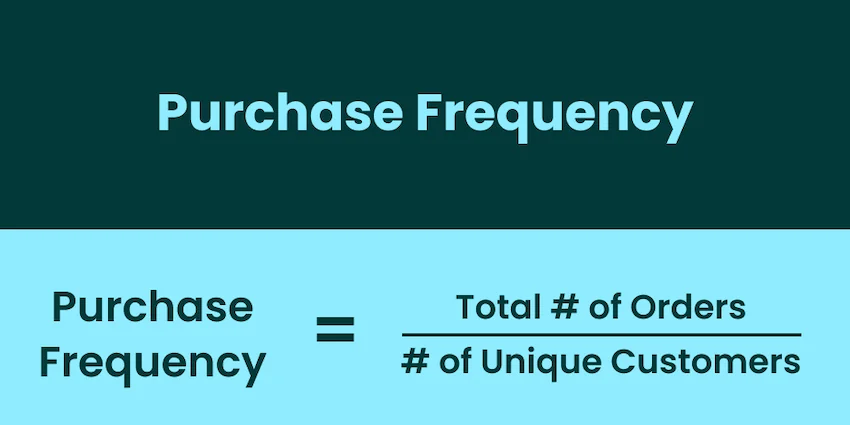
Purchase Frequency measures the average of how many times customers buy from you in a given timeframe.
Here’s the formula for Purchase Frequency:
Purchase Frequency = Total # of Orders / # of Unique Customers
Let’s say you get 1,000 orders in a year, and you have 500 different customers, then your Purchase Frequency would be 2. This means that on average, your customers placed two orders for that year. It’s also a good idea to compare the most recent year to a longer average to see if your Purchase Frequency is increasing, decreasing, or staying about the same.
Usually, the longer a customer stays on your website, the better, as this means that they are engaging with your website. Average Session Duration tracks how long your customers stay on your website. With a higher Average Session Duration, they are spending more time with your brand, which increases their likelihood to convert.
To track Session Duration, you need an Analytics tool, like Google Analytics, which is integrated with your website to collect data like this.
Net Promoter Score (NPS) tracks customers’ experiences with your brand. NPS tracks this by implementing a survey that asks the customer how likely they are to share your brand on a scale of 1-10. It’s good practice to have this survey right after their purchase and after they receive the product. Doing it like this will help you to better understand the customer journey by comparing their expectation versus their actual experience.
Next, you sort customers by their answers. Those who responded with a score of 0-6 are labeled as detractors, who won’t promote your product and might even discourage others from buying. Customers who gave a score of 9-10 are categorized as promoters, as they are likely to have enjoyed your product enough to recommend it to others. Those scoring 7-8 are labeled as passive, meaning they are unlikely to influence others positively or negatively about your product.
To calculate your NPS, you have to subtract the percentage of detractors from the percentage of promoters, like this:
NPS = % of promoters – % of detractors.
This means if 20% of your customers fall within the promoter category, and 5% are labeled as detractors, your NPS stands at 15%.
While these 10 metrics are some of the most important ones you should be keeping track of, there are a lot of different KPIs and other metrics that you can measure. For many eCommerce brands, these 10 may be enough, but depending on your goals, there may be additional metrics that you need to be tracking and optimizing for. It’s important to understand the different metrics you can track with whatever analytics software you use, and choose the ones you need to focus on in order to achieve your goals.
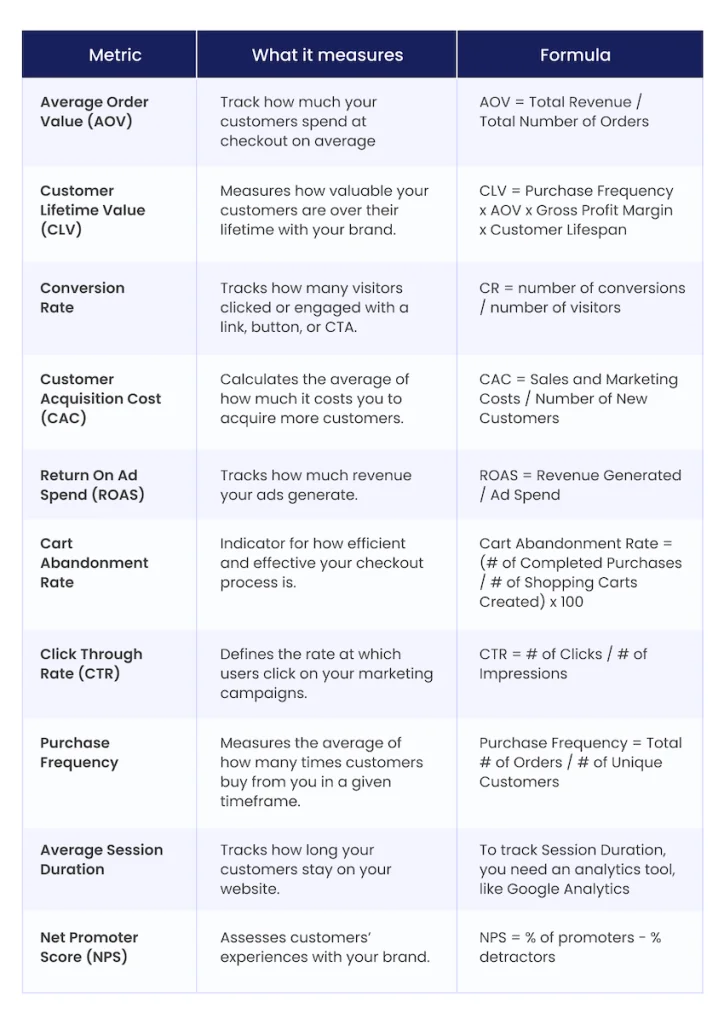
You can download this table here.
Have article ideas, requests, or collaboration proposals? Reach out to us at editor@8fig.co – we’d love to hear from you.

Crack the code to funding your eCommerce business with this step-by-step guide, and learn how to secure the capital you need to grow while staying on top of your strategy.

Stuck with extra inventory after Amazon’s Spring Sale? Learn five smart strategies to clear unsold stock, boost cash flow, and avoid future overstocks with smarter inventory planning.
![BFCM: The ultimate guide to eCommerce sales [2025]](https://www.8fig.co/wp-content/uploads/2023/09/cover-2-768x432.jpg.webp)
Get ready for Black Friday and Cyber Monday with our guide on maximizing sales through smart inventory management, effective marketing strategies, and leveraging eCommerce financing.