X
How effective are your eCommerce marketing campaigns? Is your advertising spend paying off for your business? These questions are important for the success of your eCommerce store. However, they can be difficult to answer without the proper metrics and data.
When it comes to marketing, there are several key metrics that all eCommerce sellers should track. They can provide you with an accurate understanding of how effectively your business’s marketing efforts are functioning, help you set and achieve goals, and identify areas in need of improvement.
Knowing which KPIs, or key performance indicators, to track is only the first step, though. It’s also important to understand how to use them to improve your business.
In this blog post, we break down the top five eCommerce marketing metrics that all businesses should track, as well as how to best utilize the data to grow your business.
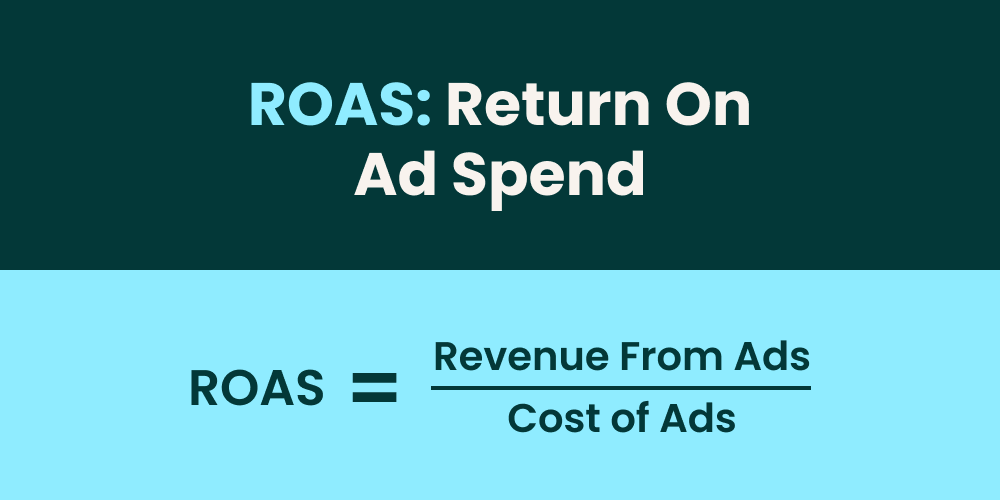
One of the most most commonly discussed marketing metrics in eCommerce is ROAS, or return on advertising spend. This measure tells you how much revenue your business brings in from ads in relation to the cost of those same ads.
ROAS is expressed as a ratio, communicating how many dollars you make for every dollar you spend on ads. If your ROAS is 5, it means that for every dollar you spend on ads, you make $5 in revenue.
You can calculate ROAS simply by dividing the revenue you make from ads by the amount of money you spend on those same ads.
ROAS is an important KPI for determining the success of your ad campaigns. You want to make sure that they are performing well enough to contribute to your overall success, not sucking much needed working capital out of your budget with little return.
Remember that a higher ROAS means more return on each dollar spent. If you made $10,000 in revenue from a PPC (pay per click) campaign that cost your company $2,000, your ROAS will be 5, or 5:1. This simply means that for every $1 you spend on ads, you generate $5 in revenue.
So, what’s a good ROAS? According to Liran Hirschkorn, eCommerce expert and CEO of Incrementum Digital, a ROAS of 3 is a pretty good target, but there is really no one-size-fits-all answer to that question. That’s because there are simply too many variables that go into setting your business’s strategy and goals.
For example, if you’re selling a new product, one that doesn’t yet have many customer reviews, you may have to spend more on ads, lowering your ROAS. At the beginning of a product’s lifecycle, in order to build up traffic and bring in reviews, an effective advertising campaign tends to cost more. Plus, without the social proof of reviews, potential customers need more convincing to make a purchase.
Later on in the life of a product, once it has thousands of reviews and is ranking well, you can aim for a much higher ROAS.
A stable supply chain that allows you to avoid stockouts will help you maintain a higher ROAS, too. When you sell out of a product, it naturally lowers your ROAS, since you can’t bring in revenue on sales no matter how much you spend on advertising. Therefore, make sure you pay attention to your supply chain and inventory levels.
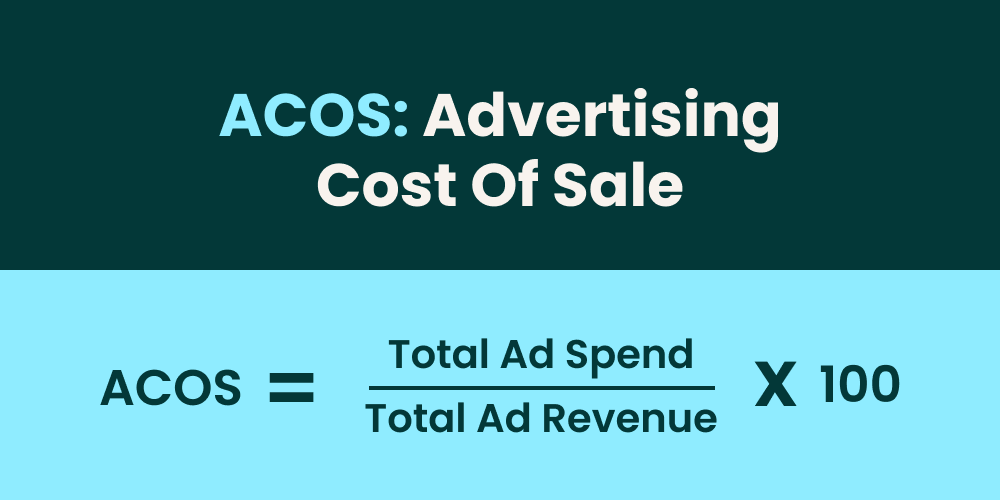
One of the most frequently used metrics on Amazon, ACOS stands for advertising cost of sale. It measures the amount of money spent on PPC campaigns in relation to how much revenue they generate. This helps sellers understand if their campaigns are working.
ACOS is the inverse of ROAS. It is expressed as a percentage that reveals how much you spend on ads to generate $1 in revenue from those same ads. If your ACOS is 25%, for example, that means that you spend $0.25 on ads for every $1 that they generate in revenue.
Calculate ACOS by dividing your total ad spend by the ad revenue. Then, multiply by 100 to get a percentage.
An understanding of ACOS is a big advantage when making decisions about your ad spend. Put simply, it lets you know whether your campaigns are working or not.
A lower ACOS means that you spent less to generate revenue. Therefore, a lower ACOS is generally a sign that your advertising efforts are performing well. However, as with any marketing KPI, it depends on your product and what you’re trying to achieve.
It’s vital to keep your profit margin in mind when evaluating your ACOS. Since companies want to make a profit on their advertising campaigns, or at the very least break even, aim for an ACOS that is lower than your profit margin. That keeps you from spending more on ads than you’re bringing in on sales.
In order to calculate your break-even ACOS, or the ACOS at which you are neither making a profit nor losing money on ads, first figure out your pre-ad profit per sale. If you spend that full amount on advertising, you won’t make any profit, but you also won’t be losing any money. This is your break-even ad cost per product.
Turn this value into your break-even ACOS by simply dividing it by sales revenue for that product. You’ll be left with a percentage that represents your break-even ACOS.
For example, if a product that costs $10 brings in a profit of $6, you don’t want to spend more than $6 on advertising for that product, or you’ll lose money on the sale. Determine your break-even ACOS by dividing $6 by $10 and multiplying by 100, which gives you a break-even ACOS of 60%.
In this example, you then know that if your ACOS is higher than 60% you’ll be losing money on your advertising campaign, a bad sign for your business. If your ACOS is lower than 60%, on the other hand, your ads are indeed bringing in a profit.
Keep in mind that your ACOS is time specific. You might have a significantly different ACOS from month to month, so make sure you know which time period you are targeting.
As with most KPIs, there is no “good” or “bad” ACOS; it depends on a number of factors. However, many experts suggest a target ACOS of around 15-25%. That being said, if you’re trying to increase your brand awareness or product visibility or trying to dramatically increase sales of a product, a higher ACOS might be acceptable.
TACOS stands for total advertising cost of sale. This key metric lets you know the relationship between the amount you spend on advertising and your total sales revenue. It’s different from ROAS because it includes your organic revenue in addition to revenue from paid advertising.
Since ROAS doesn’t account for this connection, it’s vital to keep an eye on TACOS, too. In fact, Liran told us that this is one of the most important metrics to track. It can be particularly useful to sellers because there is a relationship between advertising and organic positioning on Amazon.
TACOS is expressed as a percentage. You can calculate your TACOS by dividing your ad spend by your total revenue. Remember, total revenue includes both revenue from your paid advertising campaign as well as organic sales. Then, multiply the result by 100 to get a percentage.

Unlike ROAS, which only measures the success of your advertising campaigns, TACOS helps you understand your advertising spend in relation to your full business performance. This is vital because your advertising campaigns influence your organic placement and sales, too.
When tracking TACOS, you generally want to look at its change over time. In most cases, a stable or decreasing TACOS is a good indicator of business growth. Either your ad spend is increasing at a lower rate than total sales, your ad spend is decreasing while sales remain steady, or your ad spend is staying the same while sales are increasing. In other words, organic sales are becoming a larger part of your total revenue.
An increasing TACOS, on the other hand, suggests that your ad spend is not generating a correlating increase in organic sales. If that’s the case, you know that it’s time to rethink your marketing strategies and optimize your campaigns and product page in order to increase sales.
It’s also a good idea to look at your TACOS in relation to ACOS. While the ultimate goal is generally to see both TACOS and ACOS decrease, this also depends on the life stage of your product. When you first launch a product, it’s common for TACOS and ACOS to both increase. That’s because you need to pay more per sale in order to increase traffic and get your product started. Later on, however, your organic sales should begin to increase, lowering your TACOS.
Be wary if your TACOS is increasing while ACOS is decreasing. This means that your advertising revenue is becoming a larger and larger part of your total revenue, an indicator that your marketing efforts aren’t paying off.
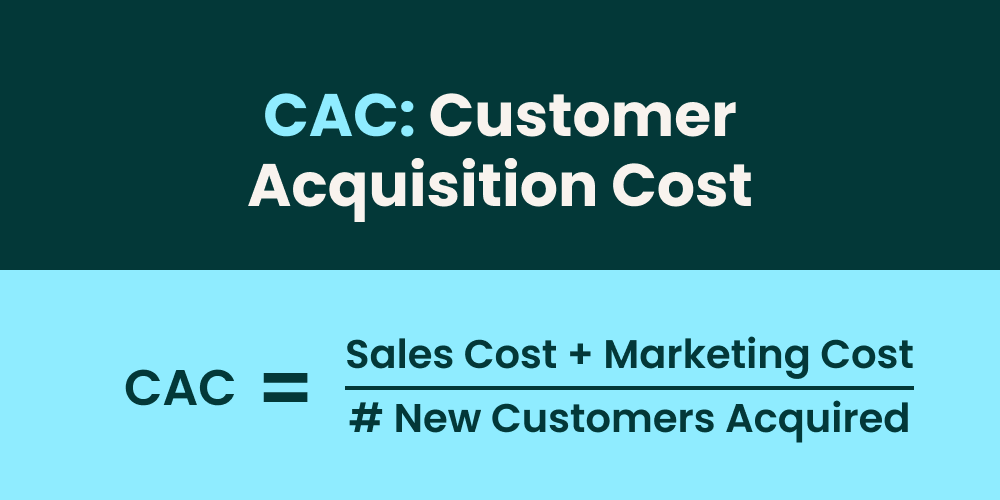
CAC, or customer acquisition cost, measures the total amount you spend in order to convert a lead into a customer. It takes into account both your cost of sales as well as your marketing spend.
This important KPI lets you know if your marketing efforts are working efficiently and if your investments in customer acquisition are paying off.
Since CAC is the cost of acquiring a customer, it’s expressed as an amount of money. You can calculate it by adding together the cost of sales and your marketing cost over a set period of time, and dividing this sum by the number of new customers you acquired during that same time period. The result is the amount of money you spent to get a new customer.
It’s easy to understand why companies might strive to decrease their CAC. A lower CAC means that you are using up fewer resources in order to gain new customers. This is a sign that your marketing efforts are working effectively and efficiently. You’re not wasting valuable funds on advertising and your leads tend to be a good fit.
A high CAC, on the other hand, can signify that something isn’t working quite right in your acquisition strategy. Perhaps you’re not targeting the right demographic, a competitor is reaching potential customers before you, or your campaign isn’t driving traffic to your website.
As with the other KPIs, however, your CAC is an individual metric and your target should reflect both your unique product and your current business goals. In addition, the average CAC varies greatly across industries.
If you sell a consumable item or a product that customers tend to buy repeatedly, you might be willing to invest more in each customer because you expect them to make repeat purchases. Alternatively, if you sell a product that customers buy just once, you probably won’t want a high CAC.
Therefore, it’s wise to look at your CAC in relation to your customer lifetime value, or LTV. The LTV is the amount of revenue that a customer is expected to generate over the course of their lifetime with a company. A company’s LTV to CAC ratio, or LTV: CAC is a great indicator of how well your marketing efforts are working.
Since you want to maximize your LTV while minimizing your CAC, many businesses strive for an LTV: CAC ratio of 3:1 or higher. That means that you’re making plenty of profit off of your average customer, and that your customer acquisition strategy is helping your business.
If your LTV: CAC ratio is lower than 3:1, you may want to find ways to shorten your sales cycle, optimize your conversion rate, or rethink your advertising spend.
Your AOV, or average order value, tells you the average amount of money a customer spends when they place an order. While it’s a very simple metric to calculate, it can give you a whole lot of information about your customer behavior.
In fact, according to eCommerce expert and founder of My Wife Quit Her Job Steve Chou, AOV is one of the most important metrics to track. It can help you set goals for growth, help you get the most value from your customers, and provide you with information as to whether your marketing strategies are working.
To calculate AOV for a given period of time, simply divide your total revenue by the number of orders placed. The resulting AOV is expressed as an amount of money. This is the average amount a customer spends when they make a purchase from your brand.
Once you figure out your AOV, you can use it to evaluate your advertising spend, pricing strategy, customer behavioral trends, and more.
Naturally, since a higher AOV means you’re bringing in more revenue per customer, a higher AOV means a higher ROAS. As long as your profits increase when your customers spend more money, increasing your AOV also indicates increased profits.
While trying to raise your AOV tends to be a good strategy for most brands, it’s not helpful to compare your AOV with others, unless they sell the same product. Since the cost of products varies from store to store, your AOV will be specific to your brand. In order to evaluate your AOV and use it to improve your marketing and sales strategies, you should look at it in relation to your pricing model.
For example, if you sell toys for $5, $9, and $16, and have an AOV of $8, this gives you some valuable information about your customers’ buying habits. You know that customers tend to buy just one toy, and that the less expensive toys account for most of your sales. You can then adjust your strategies and goals based on this information.
Steve told us that he likes to use AOV to identify customers with a high potential lifetime value, and then target them for future sales. After he calculated his store’s AOV, he noticed that nearly half of his customers make purchases with a value far lower than his AOV. Those purchases make up only 12% of his company’s sales. However, about 10% of his customers spend twice his AOV, and their purchases make up almost 50% of his sales!
With this information in hand, Steve realized that there wasn’t much value in focusing advertising dollars on the customers making small, one-time purchases. Instead, he increased his focus on the 12% of customers making larger purchases, helping him increase sales and profits even more.
It’s a good idea to consider your customer lifetime value in relation to your AOV, as Steve did. If your LTV is too low, it means that customers aren’t making repeat purchases, which could signify a lower return on investment even if your AOV is high. You also want to keep an eye on your conversion rate, since increasing your AOV isn’t particularly helpful if your conversion rate falls significantly.
There are many strategies that can help you improve your AOV. These include offering free shipping if customers pass a minimum purchase threshold, upselling similar items to those in a customer’s shopping cart, cross-selling products that go well with items a customer views, and offering coupons or bundle deals.
There’s no question that marketing metrics are immensely valuable for eCommerce sellers, but they can be tough to track.
Well, we have good news for you. 8fig is excited to announce the upcoming launch of a comprehensive Marketing Dashboard that will allow you to track all of these essential KPIs in one place. Our all new Marketing Dashboard will be free to all eCommerce sellers.
This is in addition to our Sales Analytics Dashboard, which provides eCommerce sellers with useful sales metrics, forecasting, and benchmarks. And if you’re looking for working capital to further your marketing efforts, look no further than 8fig’s cash flow-friendly eCommerce growth platform. We provide eCommerce sellers with continuous, flexible funding injected into their supply chain right when they need it. Sign up today and find out how 8fig can help you grow your business with a personalized Growth Plan designed especially for your business.

Crack the code to funding your eCommerce business with this step-by-step guide, and learn how to secure the capital you need to grow while staying on top of your strategy.

Stuck with extra inventory after Amazon’s Spring Sale? Learn five smart strategies to clear unsold stock, boost cash flow, and avoid future overstocks with smarter inventory planning.
![BFCM: The ultimate guide to eCommerce sales [2025]](https://www.8fig.co/wp-content/uploads/2023/09/cover-2-768x432.jpg.webp)
Get ready for Black Friday and Cyber Monday with our guide on maximizing sales through smart inventory management, effective marketing strategies, and leveraging eCommerce financing.