X
Here at 8fig, we know what it’s like to run an eCommerce business. As a successful seller, you live and breathe numbers, from monthly revenue to COGS (cost of goods sold). We know how important data is in order to track your performance, keep an eye on product trends, forecast future demand, and more. However, it can be quite a challenge to stay on top of all of that data.
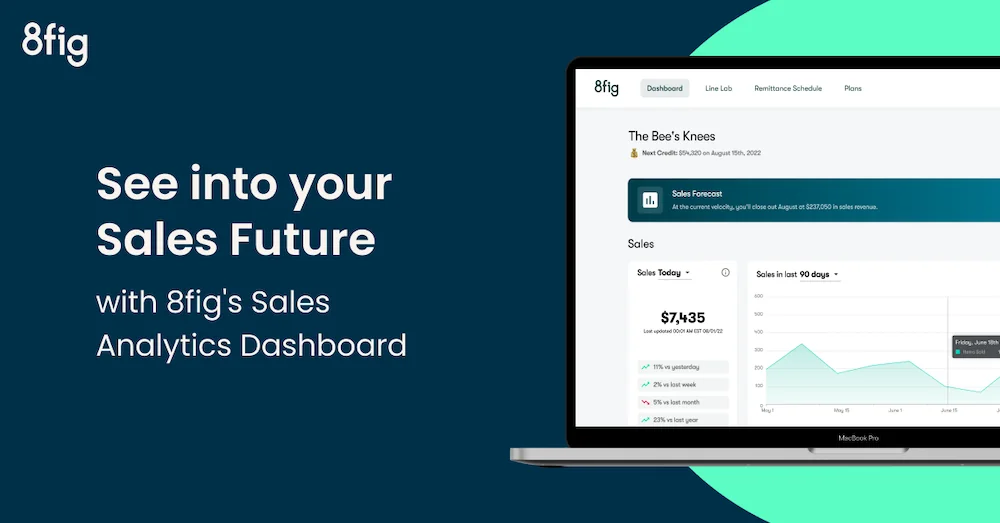
That’s why we decided to make it easier with 8fig’s Sales Dashboard.
Here, you can find all of your sales metrics on one, easy-to-use platform. Identify sales trends, track your revenue, benchmark yourself against similar sellers, and get easy access to the numbers you need to strategize and grow your business better. With all of this data in the palm of your hands, you’ll be able to gain a better understanding of your business’ performance and respond in real time to market changes.
Best of all, the Sales Dashboard is free and available to all eCommerce sellers, whether or not you receive funding from 8fig.
Check out the Sales Dashboard now!
So, what features are included in the Sales Dashboard? Here’s a breakdown of the various tools and resources currently available.
Stay on top of your sales with the Sales Summary tool. Sellers can quickly view and analyze total sales over the past day, week, or longer. Zoom in and out to identify trends and sales fluctuations earlier, putting you ahead of the game. With easily accessible real-time data, you’ll be able to react more quickly and make informed decisions to improve your business.
Visualizing your data is an important part of identifying and understanding trends. With 8fig’s Sales Graph tool, you’ll be able to do just that. Sellers can adjust their Sales Graph to display sales over customized ranges of time, giving them the ability to see micro and macro data trends. Identifying these fluctuations quickly and easily helps sellers adapt and adjust to real-time changes.
Planning ahead in eCommerce is a huge part of successfully managing your inventory and cash flow while setting and reaching sales objectives. We’re here to take the guesswork out of it. With 8fig’s sales forecasting tool, sellers can quickly check their monthly revenue projections. Then, they can use this data to adjust their sales targets and make sure their strategies are on track.
Finding and identifying top selling products is always a challenge for eCommerce sellers. 8fig makes it easy with Product Trends. Sellers can use this feature to quickly recognize top-selling products as well as those that are underperforming. With a better understanding of each product, sellers can manage their cash flow, make necessary adjustments, and increase their revenue.
A key aspect of growing your eCommerce business is optimization. You want to make sure that each stage of your supply chain is performing at its full potential. 8fig’s Forecasted Revenue Breakdown dissects your revenue into basic COGS categories, helping you identify strengths and weaknesses in your cash flow. With this valuable information, you’ll be able to optimize your business and make sure you are using your capital wisely.
Since eCommerce is often an independent venture, it can be tough to know how your strategy lines up with other successful stores. That’s where 8fig’s COGS Benchmarks tool comes in. Sellers can compare their COGS with other similar eCommerce brands in order to analyze how their spend stacks up against the competition. This valuable tool helps sellers check their strategy and ensure that they’re on the right track.
If the above tools and resources sound useful for your business (and we’re sure they do), it’s easy to get started with 8fig’s Sales Dashboard. For those who already have an 8fig Growth Plan, your Sales Dashboard is ready to use. Just sign in to your account and take a look at all that data.
If you haven’t yet signed up with 8fig, simply create an account and connect your eCommerce store. You’ll be able to view your Sales Dashboard and get insights to better grow your business in no time.
8fig is here to help eCommerce sellers grow their businesses and reach success at any stage of their journey. With our Sales Dashboard, we’ve put together the tools and resources sellers need to scale smarter. Try it out now to anticipate your store’s needs so you can plan ahead, make better decisions, and grow your business faster.

Crack the code to funding your eCommerce business with this step-by-step guide, and learn how to secure the capital you need to grow while staying on top of your strategy.

Stuck with extra inventory after Amazon’s Spring Sale? Learn five smart strategies to clear unsold stock, boost cash flow, and avoid future overstocks with smarter inventory planning.
![BFCM: The ultimate guide to eCommerce sales [2025]](https://www.8fig.co/wp-content/uploads/2023/09/cover-2-768x432.jpg.webp)
Get ready for Black Friday and Cyber Monday with our guide on maximizing sales through smart inventory management, effective marketing strategies, and leveraging eCommerce financing.